

share on
Total employment in Singapore saw the sharpest quarterly contraction ever recorded, in Q1 2020, the Ministry of Manpower's latest Labour Market First Quarter 2020 report revealed.
The report outlined six key takeaways on total employment, unemployment rates, number of retrenchments and more, as follows:
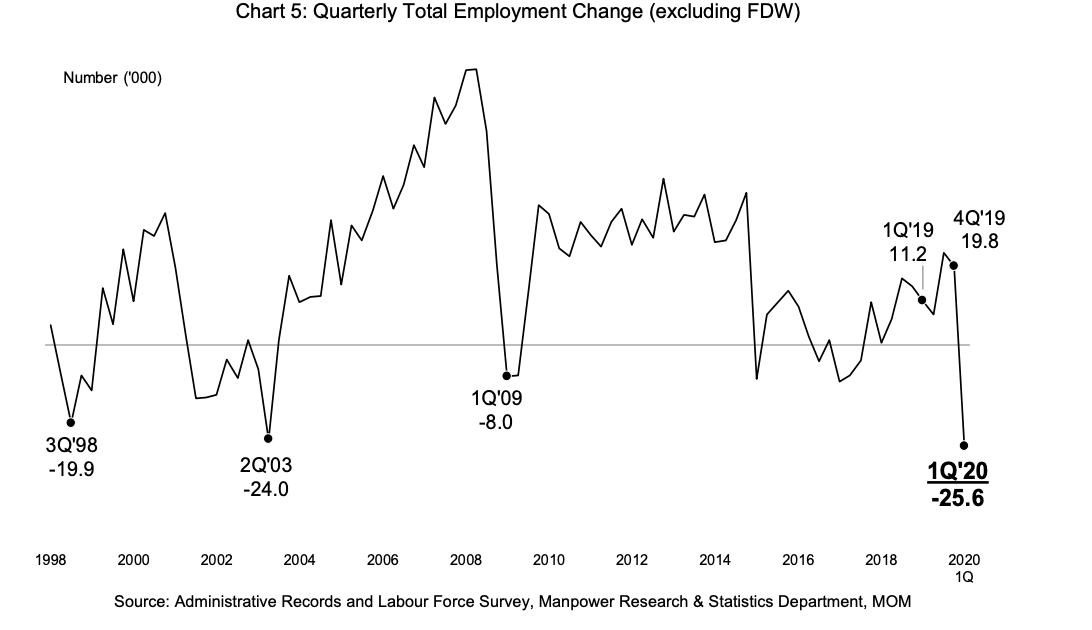
#1 Record-low decline in total employment observed
Total employment in Q1 had dropped by 25,600 from Q4 2019, and stood at 3,497,100 as at March 2020. According to the report, this drop was attributed to a "significant fall" in foreign employment.
That said, local employment was also found to have contracted slightly too, as "sharper than expected declines" in the trade and tourism-related sectors outweighed increases in financial & insurance services, public administration & education, and professional services.
Breaking down the developments, Patrick Tay, NTUC's Assistant Secretary-General (ASG) said his biggest concern is that the first quarter's labour market does not yet fully reflect the ramifications of the COVID-19 pandemic and two months of Circuit Breaker.
"Although many unionised companies are tapping on the various government support schemes and training funding to cut costs and save jobs, I am aware that many non-unionised companies are starting to feel the heat and planning to take or have taken resolute actions to manage excess manpower including becoming insolvent.
"We should pay close watch to the Q2 report and also in the second half of the year when the effects of the Jobs Support Scheme are gradually tapered down. I do expect both retrenchment and unemployment to increase over the remaining quarters of 2020."
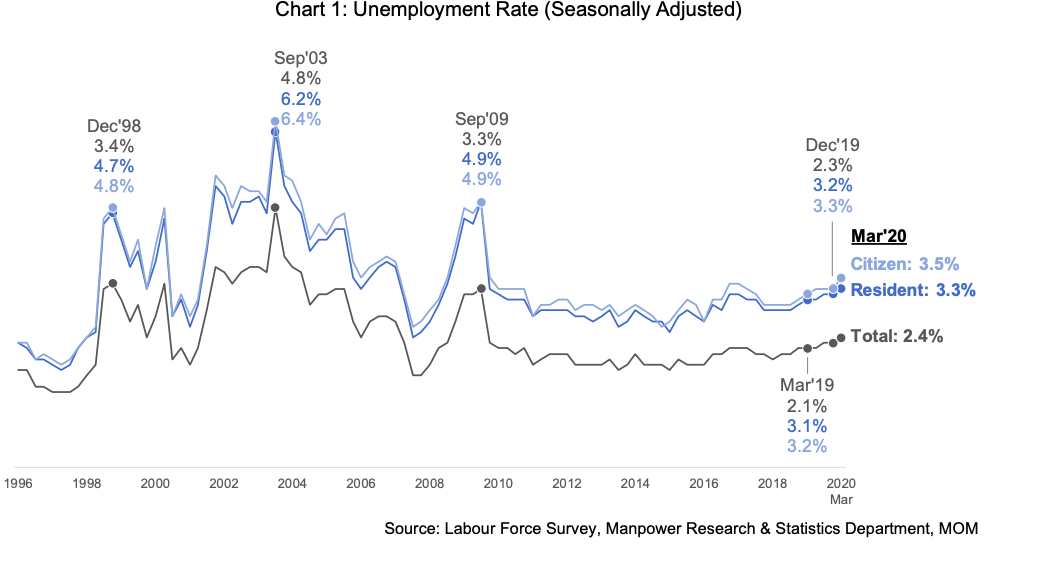
#2 Unemployment rises q-on-q from 2.3% to 2.4%
The overall seasonally-adjusted unemployment rates rose over the quarter from 2.3% in Q4 2019 to 2.4% in Q1 2020.
- Resident unemployment: Rose from 3.2% to 3.3%; and
- Citizen unemployment rose from 3.3% to 3.5%.
On a positive note, these figures remained lower than the previous recession highs during SARS and the Global Financial Crisis (GFC), the report noted.
Apart from the above, more people were unemployed in March 2020 (Resident: 76,200; Citizen: 66,900), versus in December 2019 (Resident: 73,900; Citizen: 63,500).
As for the long-term unemployment rate - this figure held steady in March 2020 at 0.9%, the same as observed in December 2019 (Q4 2019).
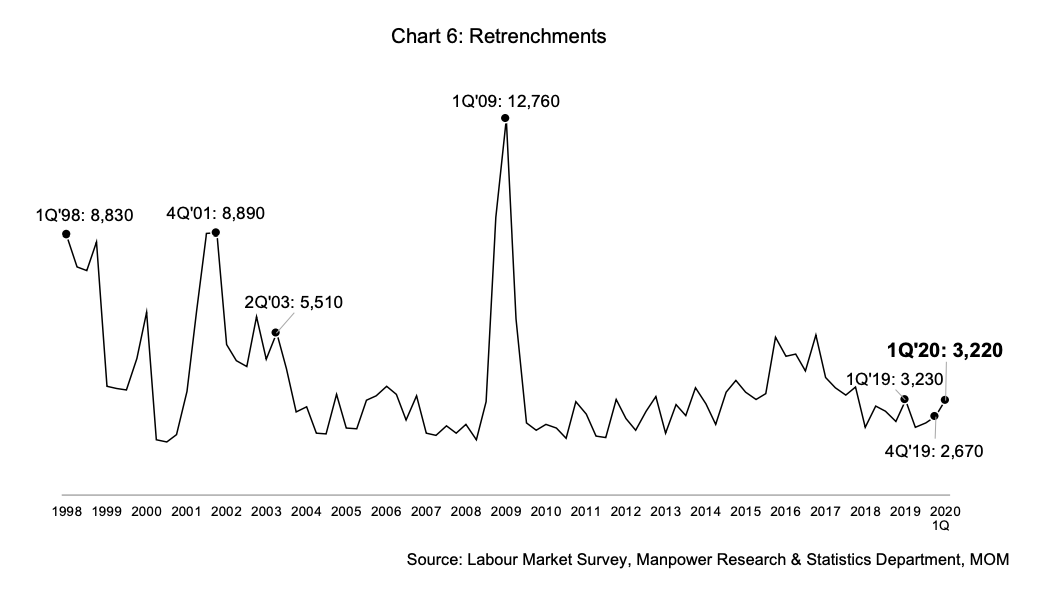
#3 Retrenchments rise, albeit lower than during the Global Financial Crisis
While COVID-19 has indeed resulted in some companies having to implement retrenchments, though as a last resort, the number of retrenchments recorded in Q1 2020 (3,220) was still 'significantly lower' than recorded at the peak of the GFC (Q1 2009: 12,760).
However, it did rise q-on-q from the previous quarter, up from 2,670.
Based on the report, the increase was largely due to sectoral downturn or poor business, with retail trade, accommodation, and food & beverage services seeing the largest increases (mainly non-PMETs).
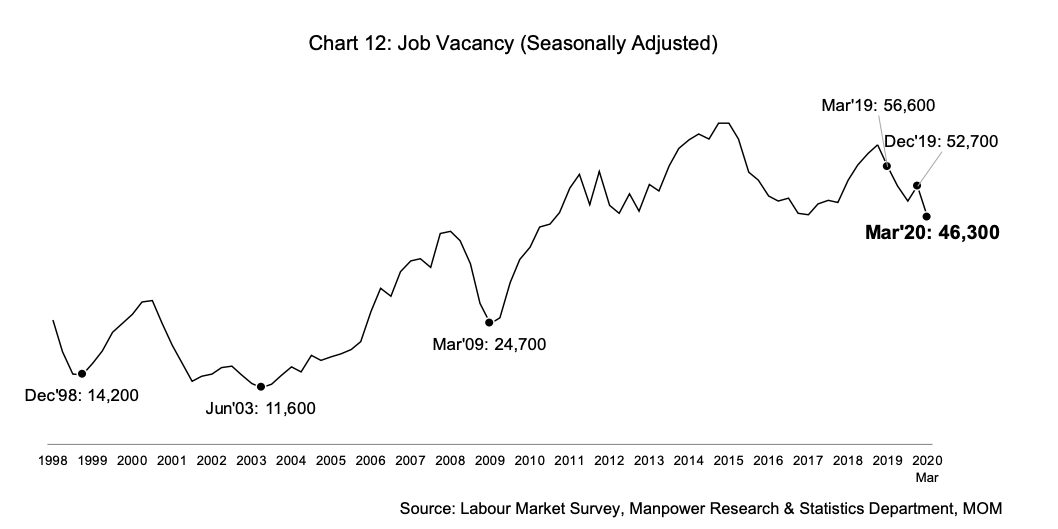
#4 While overall demand for labour eased, some sectors saw a slight rise in vacancies
In another record-low moment, the seasonally-adjusted number of job vacancies in Q1 2020 (46,300) declined to its lowest since September 2010 (44,900). This decline was widely observed in the food & beverage, services, and arts, entertainment & recreation sectors.
As a result, the ratio of job vacancies to unemployed persons declined to a decade low (0.71)), while still remaining above recessionary lows.
On the contrary, sectors such as electronics manufacturing, information & communications, health & social services, and wholesale trade saw a rise in job vacancies.
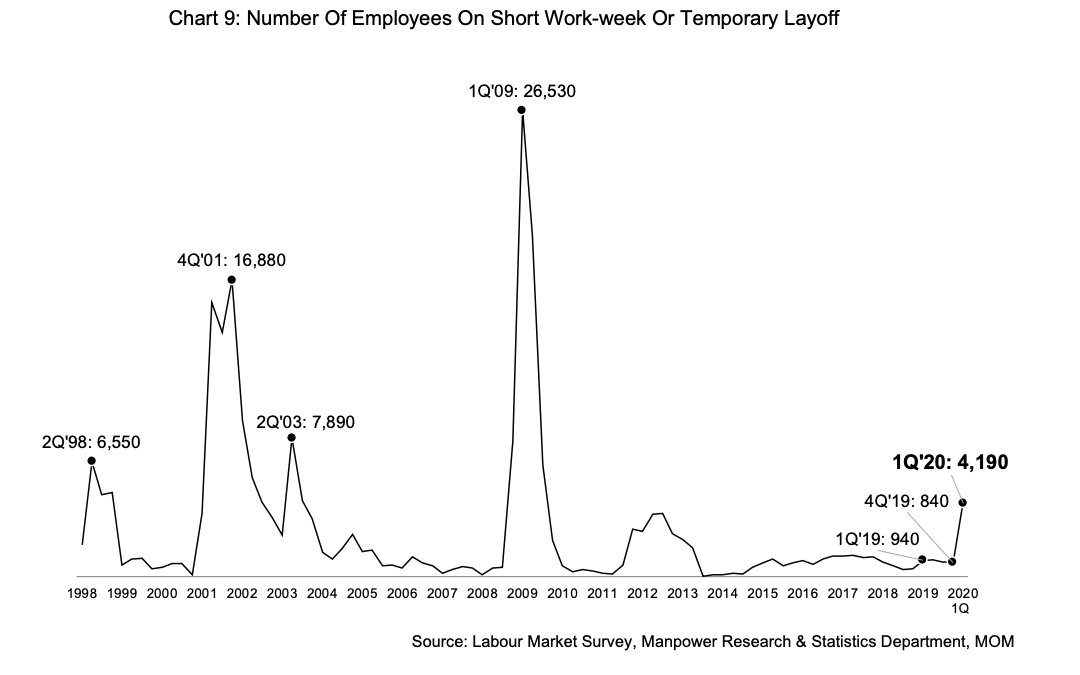
#5 4,190 staff placed on shorter work-weeks or temporary layoffs
Instead of retrenching staff, a number of employers decided temporary adjustments to manage their excess manpower and reduce business costs, such as shorter work-weeks or temporary layoffs.
In Q1 2020, 4,190 employees were placed in such arrangements, a fivefold increase from the preceding quarter (840). Once again, it still remained below the high number observed during the GFC (Q1 2009: 26,530).
- It was more common for employees to be placed on a short work-week (3,600) than on temporary layoff (600).
- The quarterly increase was concentrated in the services sector, led by wholesale & retail trade and accommodation & food services. Non-PMETs posted a larger increase (from 200 to 2,780) than PMETs (from 640 to 1,410), similar to retrenchment trends.
#6 Average paid hours/week per employee dropped by 0.3 hours q-on-q
The average weekly total paid hours worked per employee, which includes overtime hours, dropped by 0.3 hours q-on-q, recording at 44.4 hours in March 2020 (December 2019: 44.7).
This reflected the largest quarterly decline in paid overtime hours since March 2009, the report further stated. This decline was broad-based across industries and most notable in accommodation, on the back of a sharp decline in tourist arrivals.
Employers who reported that their workforce worked fewer hours had employed an estimated 1.4 million employees.
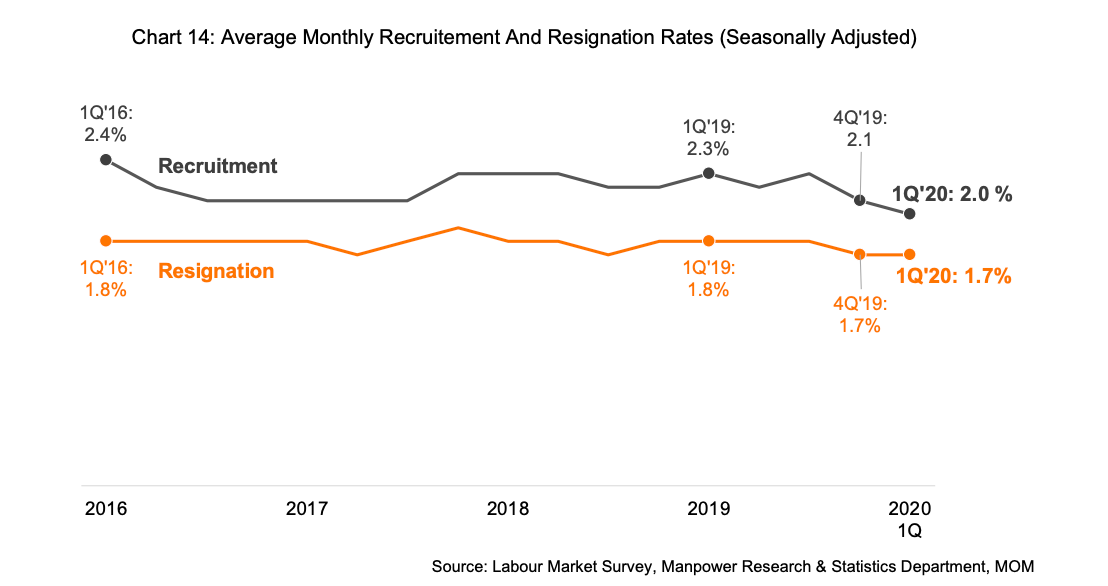
Apart from these points, in terms of labour turnover in the quarter, the seasonally-adjusted recruitment rate dipped to 2.0%, while the resignation rate held steady at 1.7%. The last such rates were observed were also during the GFC (Q2 2009: 2.0% and 1.7% respectively).
The fall in labour turnover was observed across most industries, except for those which continued to see firm demand for manpower such as information & communications, health & social services and public administration & education.
View the Ministry of Manpower's infographic here

Lead image / iStock
All graphics / MOM
share on
